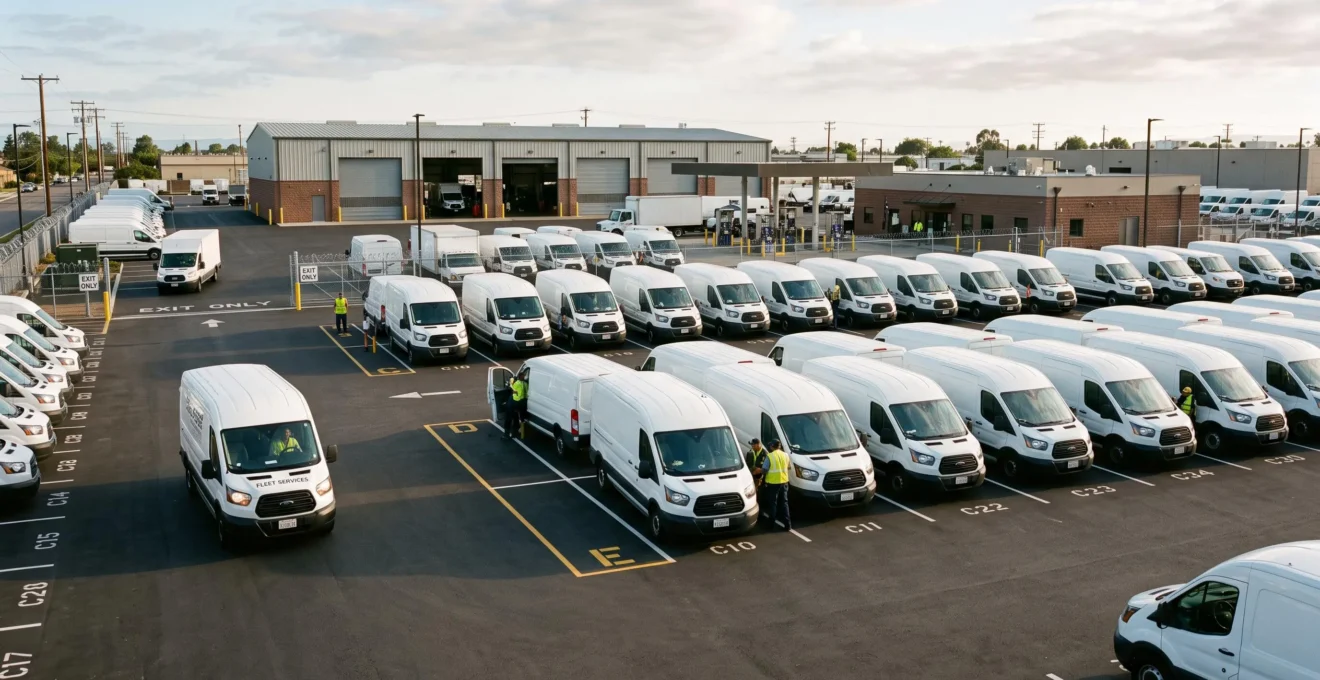
Consolidating vehicle reservations from Excel, maintenance records from an aging standalone system, and inspection reports from disconnected tablets consumes hours each week. The data never quite aligns. Utilization reports require manual cross-referencing. Billing disputes over vehicle condition lack clear digital trails. This operational reality—scattered tools generating friction rather than insight—drives many fleet managers toward integrated platforms. The challenge: choosing the right solution without overpaying for unused capabilities or under-equipping for actual needs.
The methodology that prevents costly mismatches starts with self-assessment, not vendor comparison. Before evaluating specific platforms, fleet operations must identify their current digital maturity level, prioritize features according to fleet size and sector, validate projected ROI with measurable benchmarks, and only then compare solutions. This sequence transforms platform selection from overwhelming feature lists into a structured decision process grounded in operational context.
- What defines a high-performance fleet management platform in 2026?
- Assess your fleet’s operational maturity before comparing solutions
- Which core features should you prioritize based on your fleet profile?
- Integration capabilities: the selection criterion most buyers overlook
- How to calculate and validate platform ROI before committing?
- From vendor shortlist to deployment: building your implementation roadmap
- Building your selection methodology before comparing solutions
What defines a high-performance fleet management platform in 2026?
The difference between managing a mid-sized commercial fleet through dispersed tools versus a centralized platform becomes tangible in daily workflows. Scattered systems require manual reservation tracking in spreadsheets, isolated maintenance software with no vehicle usage visibility, inspection tablets that need data re-entry elsewhere, and weekly consolidation sessions to produce director-level reports. Each handoff introduces error risk. Each manual step consumes administrative capacity.
To eliminate these friction points, industry leaders are moving toward unified architectures that bridge the gap between field data and office administration. Implementing a professional fleet management solution allows for the native integration of telematics, where actual usage data automatically triggers preventive maintenance and mobile-first interfaces streamline vehicle inspections. By centralizing these operations into a single source of truth, fleet managers shift from reactive task-tracking to AI-driven predictive optimization, significantly reducing the total cost of ownership.
$1.455M
Installation costs avoided when the U.S. General Services Administration activated existing telematics across 19,000 federal vehicles, demonstrating measurable technology ROI in large-scale fleet operations.
Performance standards for modern platforms center on measurable operational improvements: administrative time reduction of 8-12 hours weekly for fleets managing 50-100 vehicles, vehicle utilization rate increases of 15-20%, total cost of ownership reductions through predictive maintenance, and compliance automation for Electronic Logging Device requirements. According to industry reporting on fleet manager pilots, administrative time savings ranging from five to ten hours per week following technology adoption represent realistic benchmarks rather than aspirational vendor claims.
The operational impact of centralization extends beyond time savings. Automated workflows eliminate duplicate data entry and the errors that follow. Digital inspection trails establish clear responsibility for vehicle condition changes, resolving billing disputes with timestamped photo evidence. Real-time availability visibility prevents vehicle underutilization—a hidden cost where 20% of a fleet sits idle while daily rental alternatives are paid. Integrated dashboards surface these inefficiencies immediately rather than weeks later during manual report compilation.

Assess your fleet’s operational maturity before comparing solutions
Platform selection begins with an honest assessment of current operational maturity. A three-level framework clarifies where fleet operations currently function and what capabilities represent logical next steps rather than premature investments.
Level 1: Manual operations rely primarily on Excel spreadsheets for reservation tracking, paper-based or basic digital inspection forms requiring manual consolidation, standalone maintenance software disconnected from actual vehicle usage patterns, and reporting that demands weekly or monthly manual data compilation. Fleet managers at this level spend 10-15 hours weekly on administrative consolidation. Data accuracy depends entirely on consistent manual entry discipline across multiple disconnected systems.
Level 2: Hybrid digitalization introduces partial automation through some connected tools—perhaps telematics installed but not integrated with maintenance scheduling, digital reservation systems that still require manual billing reconciliation, or inspection apps that sync data but don’t trigger automated workflows. Silos persist despite digital tools. Integration gaps still demand manual bridging. Administrative time reduces to 6-10 hours weekly, but improvement plateaus without eliminating system boundaries.
Level 3: Integrated platform operations centralize all fleet functions in a unified system where telematics data automatically triggers preventive maintenance work orders, vehicle reservations flow directly to billing with usage-based charges, digital inspections sync immediately with condition histories, and real-time dashboards eliminate manual reporting. Administrative overhead drops to 2-4 hours weekly—primarily strategic analysis rather than data consolidation.
- How do you currently track vehicle reservations and assignments? Excel or email requests = Manual; Dedicated software but manual billing = Hybrid; Automated reservation-to-billing flow = Integrated
- How does maintenance get scheduled? Calendar-based or reactive to breakdowns = Manual; Software reminders based on miles/time = Hybrid; Automatic work orders triggered by telematics data = Integrated
- Where do vehicle inspection results go? Paper forms or tablets requiring manual entry = Manual; Digital forms synced to database = Hybrid; Inspections automatically updating vehicle records and triggering actions = Integrated
- How long does monthly reporting take? 6+ hours consolidating multiple sources = Manual; 2-4 hours combining some automated exports = Hybrid; Under 1 hour reviewing automated dashboards = Integrated
The functional priorities shift dramatically across maturity levels. Manual operations must prioritize data centralization and process simplification—eliminating the most painful friction points first. Hybrid operations need robust API integration capabilities to connect existing tools rather than replace everything simultaneously. Integrated operations can extract value from advanced analytics and AI-driven optimization that require clean, consolidated data to function effectively.
Recognizing when maturity advancement becomes operationally necessary prevents both premature investment and prolonged inefficiency. Signals include administrative time exceeding 10 hours weekly on pure consolidation tasks, frequent data accuracy errors undermining decision confidence, inability to answer director questions about utilization or costs without multi-day research, and measurable vehicle underutilization caused by lack of real-time availability visibility.
Which core features should you prioritize based on your fleet profile?
Feature prioritization depends on three contextual factors: fleet size, operational sector, and digital maturity level. Generic capability checklists ignore these variables, leading to over-investment in unused features or gaps in critical functions.
Fleet size determines scalability and complexity requirements. Operations managing 10-50 vehicles need deployment simplicity and user-friendly interfaces more than enterprise-grade analytics. The 50-200 vehicle range—typical for growing service operations—requires balanced process integration without excessive complexity. Fleets exceeding 200 vehicles justify advanced analytics, custom workflow automation, and dedicated implementation resources.
Sector-specific operational patterns drive distinct feature priorities. Field service fleets managing technician dispatch and client site visits prioritize vehicle reservation systems, preventive maintenance automation to minimize unexpected downtime, utilization optimization to reduce total fleet size needs, and integration with accounting systems for client billing. Logistics and delivery operations elevate route optimization, fuel management tracking, Electronic Logging Device compliance, and load optimization capabilities. Rental and shared fleet models require real-time availability visibility, detailed inspection workflows with photo documentation, usage-based billing automation, and customer self-service portals.
Universal core capabilities across all profiles: Real-time vehicle tracking through integrated telematics, preventive maintenance automation based on actual usage rather than arbitrary schedules, driver safety monitoring with behavior scoring, and utilization reporting identifying underused assets represent non-negotiable baseline functionality regardless of fleet size or sector.
Digital maturity level determines readiness for advanced features. Manual-level operations gain maximum ROI from centralized reservation management and automated maintenance reminders—addressing the highest-pain friction points first. Hybrid operations already have some digital tools; their priority becomes seamless integration through robust APIs and bidirectional data synchronization. Integrated operations with clean, consolidated data can leverage AI-driven predictive analytics, advanced route optimization, and sustainability reporting that require quality data foundations to deliver value.
| Feature Category | Field Services (SME vehicles) | Logistics/Delivery | Rental/Shared Fleet |
|---|---|---|---|
| Reservation/Assignment | P0 – Critical | P1 – Important | P0 – Critical |
| Preventive Maintenance | P0 – Critical | P0 – Critical | P1 – Important |
| Digital Inspections | P0 – Critical | P1 – Important | P0 – Critical |
| Utilization Reporting | P0 – Critical | P1 – Important | P0 – Critical |
| Accounting Integration | P1 – Important | P1 – Important | P0 – Critical |
| ELD Compliance | P2 – Optional | P0 – Critical | P2 – Optional |
| Route Optimization | P2 – Optional | P0 – Critical | P2 – Optional |
| Customer Self-Service | P2 – Optional | P2 – Optional | P1 – Important |
For an operation of this scale currently at manual maturity level, the prioritization framework identifies centralized reservations, automated preventive maintenance, digital inspections with photo trails, and utilization reporting as P0 critical features. Accounting system integration for client billing and basic telematics for driver behavior become P1 important capabilities. Route optimization and advanced AI analytics remain P2 optional—potentially valuable but not essential for the maturity level and operational context.
Understanding the impact of telematics on driver safety further clarifies how integrated data streams transform reactive management into proactive risk mitigation, reinforcing the prioritization of telematics integration in any modern platform selection.
Integration capabilities: the selection criterion most buyers overlook
Platform evaluations often focus on feature lists while treating integration as a checkbox item. This oversight causes post-purchase friction when the new system cannot connect seamlessly with existing ERP systems, accounting software, third-party telematics already installed, or HR tools managing driver assignments.
The real cost of data silos extends beyond inconvenience. Non-integrated systems require duplicate data entry—vehicle information entered separately in the fleet platform, the accounting system, and the ERP. Each entry point introduces error risk. Usage data from telematics sits isolated from maintenance scheduling, preventing the automated preventive workflows that justify telematics investment. Client billing for vehicle usage demands manual export, transformation, and import into accounting software, consuming hours weekly and missing billable usage that lacks clear digital trails. According to NAFA Fleet Management Association benchmarking data drawn from over 900,000 vehicles, integration gaps represent a primary source of administrative inefficiency in fleet operations.
Essential integration types to validate during vendor evaluation include REST APIs with comprehensive documentation enabling custom connections, webhooks for real-time event notifications triggering actions in connected systems, scheduled automated imports and exports maintaining data synchronization, single sign-on (SSO) authentication eliminating separate login management, and critically, bidirectional data flows rather than one-way exports that still require manual re-entry elsewhere.
Solutions offering modular and customizable approaches to integration—adapting connection architectures to existing IT ecosystems rather than forcing wholesale replacement—reduce implementation friction and preserve investments in current systems. This adaptability becomes particularly valuable for fleets with established ERP systems or specialized industry software that cannot be easily replaced.
Integration gaps discovered post-purchase: Vendor demonstrations often showcase integrations in ideal conditions. Demand proof of specific integration capabilities relevant to your ecosystem—sandbox testing with your actual data, references from clients with similar integration complexity, and detailed documentation of API endpoints and data models—before contract signature. Discovering incompatibilities after commitment triggers costly custom development or forces continued manual workarounds that eliminate projected ROI.
The measurable business impact of successful integration shows in operational metrics. Automated vehicle usage tracking synchronized with accounting systems can increase billable charge recovery by 25-35% by capturing previously forgotten usage. End-to-end maintenance workflows—telematics alert triggering work order creation automatically sending purchase orders to the ERP for parts procurement—reduce vehicle downtime through faster response while maintaining complete cost visibility without manual tracking.
How to calculate and validate platform ROI before committing?
Convincing financial leadership requires ROI calculations grounded in measurable baseline costs and realistic improvement benchmarks rather than vendor projections. The methodology starts with comprehensive current cost documentation, establishes achievable gain targets per specific KPI, accounts for total investment including hidden implementation costs, then calculates payback period.
Building the baseline requires capturing both visible and hidden costs. Visible direct costs include current software licenses, telematics subscriptions if already deployed, maintenance expenditures, fuel consumption, and insurance premiums. Hidden costs prove harder to quantify but often represent larger ROI opportunities: administrative time spent on manual data consolidation valued at hourly labor rates, vehicle underutilization calculated as unnecessary fleet size multiplied by daily ownership costs, reactive maintenance premium where unplanned downtime costs 2-3 times more than preventive service, and billing leakage from unbilled or under-billed client usage.
25-35%
Typical percentage of hidden costs in total fleet TCO—including administrative time consolidation, underutilization opportunity costs, reactive maintenance premiums, and billing leakage—that rarely appear in initial ROI calculations but represent the fastest-returning efficiency gains.
Measurable KPIs with realistic benchmark ranges provide validation checkpoints against vendor claims. Vehicle utilization rate improvements of 15-20% represent achievable targets when real-time visibility and automated reservation systems replace manual tracking. Administrative time reduction of 8-12 hours weekly for a 75-vehicle operation aligns with documented pilot results. Preventive maintenance automation typically reduces total maintenance costs by 10-15% through earlier intervention preventing expensive failures. Client billing recovery improvements of 25-35% occur when automated usage tracking eliminates forgotten charges.
Total investment accounting prevents ROI overstatement. Platform licensing costs represent only part of the equation. Implementation services including data migration, system configuration, and integration development add 20-40% to software costs. Training time for fleet managers, drivers, and maintenance staff carries opportunity costs. A realistic implementation budget for a 75-unit operation ($45,000) should allocate roughly $30,000 to platform licensing, $10,000 to implementation services, and $5,000 to training and change management.
Payback period calculation combines these elements: baseline annual costs minus projected annual costs post-implementation equals annual savings. Total investment divided by annual savings yields payback period in years. For fleet operations managing 50-200 vehicles, realistic payback periods range from 12-24 months depending on current maturity level and optimization opportunities. Manual operations with high administrative overhead and poor utilization visibility achieve faster payback than hybrid operations already capturing some efficiency gains.
Progressive validation through pilot deployment reduces risk while building CFO confidence. Implementing the platform across 15-25% of the fleet for 30-60 days enables measuring actual results—administrative time saved, utilization improvements, maintenance cost changes—before full commitment. Early-win KPIs measurable within 3-6 months, particularly administrative time reduction and utilization improvements, demonstrate ROI trajectory while more complex gains like total maintenance cost reduction require 6-12 months to validate.
A concrete calculation for a standard service fleet illustrates the methodology: Current baseline includes estimated total cost of ownership around $8,500 per vehicle annually totaling approximately $637,500, plus 10 hours weekly administrative time at $45 hourly fully-loaded cost equaling $23,400 annually, plus underutilization of roughly 20 vehicles creating unnecessary ownership costs. Projected improvements from platform implementation: 15% utilization increase reducing effective fleet size need, 10 hours weekly administrative time savings worth $23,400, 12% preventive maintenance cost reduction saving approximately $9,500 annually, and 30% billing recovery improvement adding $40,000 annual revenue. Combined annual value of approximately $72,900 against $45,000 investment yields roughly 7-month payback on administrative and billing gains alone, with full ROI including maintenance savings achieved within 15-18 months.
From vendor shortlist to deployment: building your implementation roadmap
Successful platform deployment requires structured phases from final vendor selection through operational adoption. Rushing this process or skipping validation steps triggers the disruption that concerns fleet managers evaluating change.
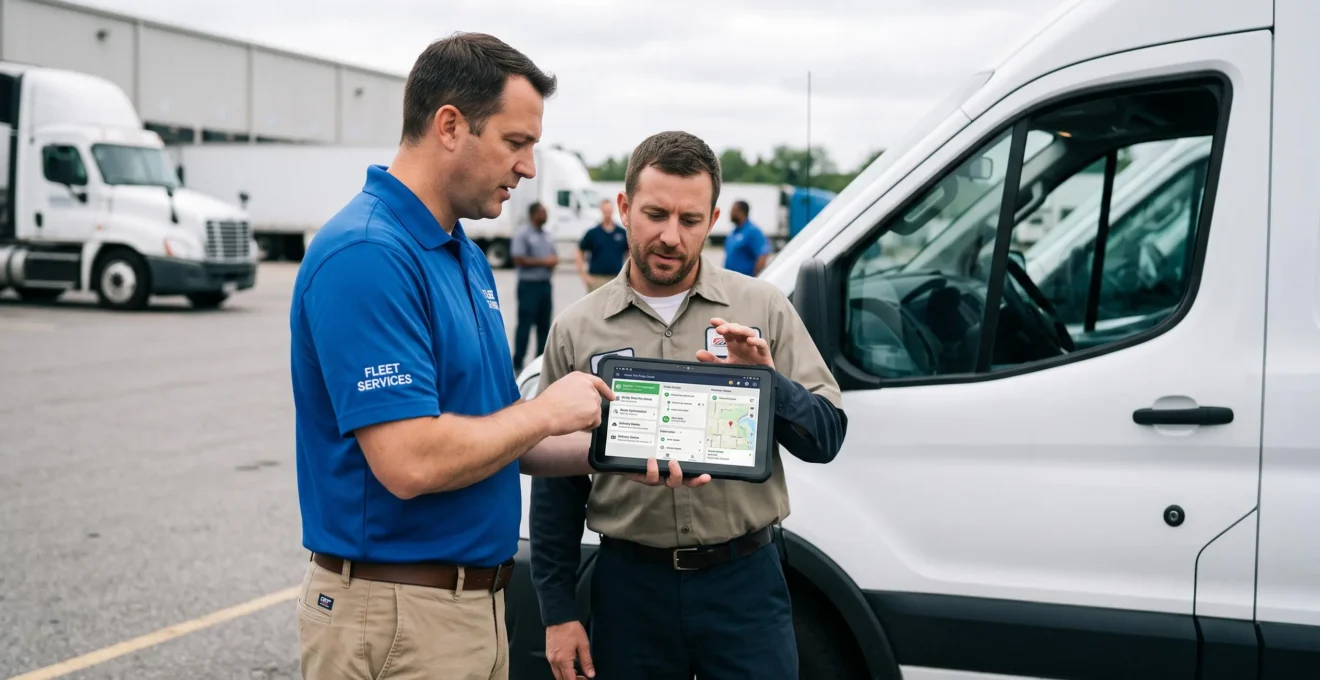
The vendor shortlist phase narrows options to 3-5 finalists through rigorous validation. Demand personalized demonstrations using your actual operational scenarios—not generic sales presentations. Request sandbox environment access for 1-2 weeks to test workflows with real data. Verify customer references from organizations with similar fleet size, sector, and integration complexity. Scrutinize service level agreements for support response times and escalation procedures. Require transparent all-in pricing covering licensing, implementation services, integrations, training, and ongoing support without hidden fees discovered later.
- Contract finalization and project kickoff (Week 1-2)Formalize agreements, establish project team including vendor implementation specialist and internal stakeholders, define success metrics and timeline.
- System configuration and customization (Week 2-4)Configure platform settings for organizational structure, vehicle categories, user roles, workflow rules, and notification preferences matching operational requirements.
- Data migration and cleanup (Week 3-5)Extract vehicle data, maintenance histories, and driver information from legacy systems. Clean inconsistencies before migration. Import and validate data accuracy in new platform.
- Integration development and testing (Week 4-6)Build connections to ERP, accounting software, existing telematics, and other critical systems. Test bidirectional data flows and automated workflows under realistic scenarios.
- Pilot group selection and training (Week 6-7)Select representative pilot segment of 15-25% of fleet. Conduct role-specific training for pilot drivers, maintenance staff, and administrative users.
- Pilot deployment and monitoring (Week 8-12)Launch platform for pilot group. Monitor daily usage, gather user feedback, measure KPIs against baseline, identify workflow adjustments needed before full rollout.
- Pilot validation and optimization (Week 12-14)Validate that pilot achieved target KPIs. Implement process refinements based on user feedback. Document lessons learned and adjust training materials.
- Full fleet rollout and adoption support (Week 14-20)Deploy platform across remaining fleet in managed waves. Provide intensive support during first 30 days. Track adoption metrics and address user resistance proactively.
Pilot strategy minimizes disruption risk through controlled validation. Select a pilot segment representing 15-25% of the fleet that includes diverse vehicle types and usage patterns without comprising mission-critical operations. Duration of 30-60 days provides sufficient time to measure meaningful results. Define specific success criteria before pilot start: administrative time reduction targets, utilization improvement goals, user satisfaction thresholds, and zero data loss requirements. Structured feedback collection from pilot users identifies workflow friction points requiring adjustment before wider deployment.
Implementation timeline expectations for regional fleet operations typically span 4-6 months from contract signature to full operational deployment. Factors accelerating timelines include executive sponsorship removing decision bottlenecks, dedicated project team availability, clean well-structured legacy data, and standard integration requirements. Factors causing delays include complex custom integrations with legacy systems, poor quality legacy data requiring extensive cleanup, user resistance to change without adequate change management, and lack of dedicated project resources forcing implementation to compete with daily operations.
User adoption determines whether platform investment delivers projected ROI. Critical success factors include role-specific training addressing how each user group benefits—drivers see simplified inspection processes, maintenance staff get automated work orders, fleet managers gain real-time visibility. Communicating individual benefits proves more effective than organizational efficiency messaging. Accessible support during the critical first 60 days prevents frustration abandonment. Quick wins visible within weeks—such as faster vehicle assignment or simplified inspection workflows—build momentum and positive perception.
What happens to our existing Excel data and maintenance records during migration?
Reputable vendors provide data migration services as part of implementation. The process extracts vehicle information, maintenance histories, and operational records from spreadsheets and legacy systems, cleanses inconsistencies, then imports into the new platform. Expect to dedicate 2-3 weeks to data preparation and validation. Legacy data typically remains accessible as backup during the first 90 days until confidence in new system completeness is established.
How much daily operational disruption should we expect during rollout?
A properly managed pilot deployment minimizes disruption to mission-critical operations. The pilot phase intentionally selects non-critical fleet segments for initial deployment, allowing learning and adjustment before expanding. Full rollout occurs in waves rather than all vehicles simultaneously. Most fleets report 2-3 weeks of reduced productivity during initial adoption as users adapt to new workflows, followed by efficiency gains that exceed baseline within 60 days.
Who trains our drivers on the mobile app, and how long does it take?
Platform vendors typically provide train-the-trainer programs where your fleet managers or designated super-users receive comprehensive training, then cascade to drivers. Driver training for basic functions—vehicle check-out, digital inspection, check-in—typically requires 20-30 minutes per driver. Modern mobile interfaces designed for field use minimize training requirements compared to complex desktop systems. Hands-on practice during pilot phase identifies workflow adjustments before training remaining drivers.
What level of support should we expect after go-live?
Validate support terms in the service level agreement before contract signature. Standard support typically includes email and phone access during business hours with response time commitments—4 hours for critical issues affecting operations, 24 hours for non-critical questions. Premium support packages may offer 24/7 availability and faster response. Most implementations include intensive vendor support for the first 30-60 days post-deployment, then transition to standard ongoing support. Clarify whether support is included in licensing fees or represents additional cost.
How do we handle user resistance from staff comfortable with current processes?
Change management begins with explaining individual benefits rather than only organizational efficiency. Drivers resist new inspection apps until they understand digital records protect them from false damage claims. Fleet managers resist new reporting until they experience how real-time dashboards eliminate weekly consolidation sessions. Identify influential early adopters as champions who demonstrate benefits to skeptical peers. Executive sponsorship signaling that adoption is a priority—not optional—establishes accountability while comprehensive training reduces frustration-based resistance.
Exploring the future of AI-driven fleet operations reveals how advanced optimization capabilities build on the integrated data foundations established through proper platform implementation, offering a roadmap for continuous improvement beyond initial deployment.
Building your selection methodology before comparing solutions
Platform selection that begins with vendor comparison—evaluating feature lists, pricing tiers, and marketing promises—frequently results in mismatched investments. Solutions over-engineered for current needs waste budget on unused capabilities. Under-equipped platforms create new frustrations when critical workflows remain unsupported. The sequence matters: assess operational maturity level first, prioritize features according to fleet size and sector context, validate projected ROI with measurable benchmarks, verify integration compatibility with existing systems, then evaluate specific vendors against these contextual requirements.
The methodology transforms an overwhelming marketplace into a structured decision process. A service operation with dozens of vehicles currently managing reservations through Excel, maintenance through aging standalone software, and inspections through disconnected tablets can identify Manual maturity level, prioritize centralized reservation management and preventive maintenance automation as P0 critical features, calculate ROI based on 10 hours weekly administrative time savings and 15% utilization improvement, and validate that accounting system integration exists before shortlisting vendors. This framework prevents selection driven by impressive demonstrations that showcase capabilities irrelevant to immediate operational needs.
The next actionable step requires honest operational maturity assessment using the four-question framework. That self-diagnosis determines whether current priorities center on eliminating manual consolidation friction, connecting partially digital tools through integration, or leveraging advanced analytics on established clean data. Platform selection succeeds when the chosen solution matches the organization’s actual maturity level and operational context—not when it offers the most features or the lowest price detached from fitness for purpose.